This week’s workshop on sensory mapping deepened my understanding of how data can be experienced beyond visual representations. At first, we closely feel biscuits and leaves through sight, touch, smell, and taste. This experience shows us how multi-sensory exploration could deepen our understanding of data beyond traditional visual methods.
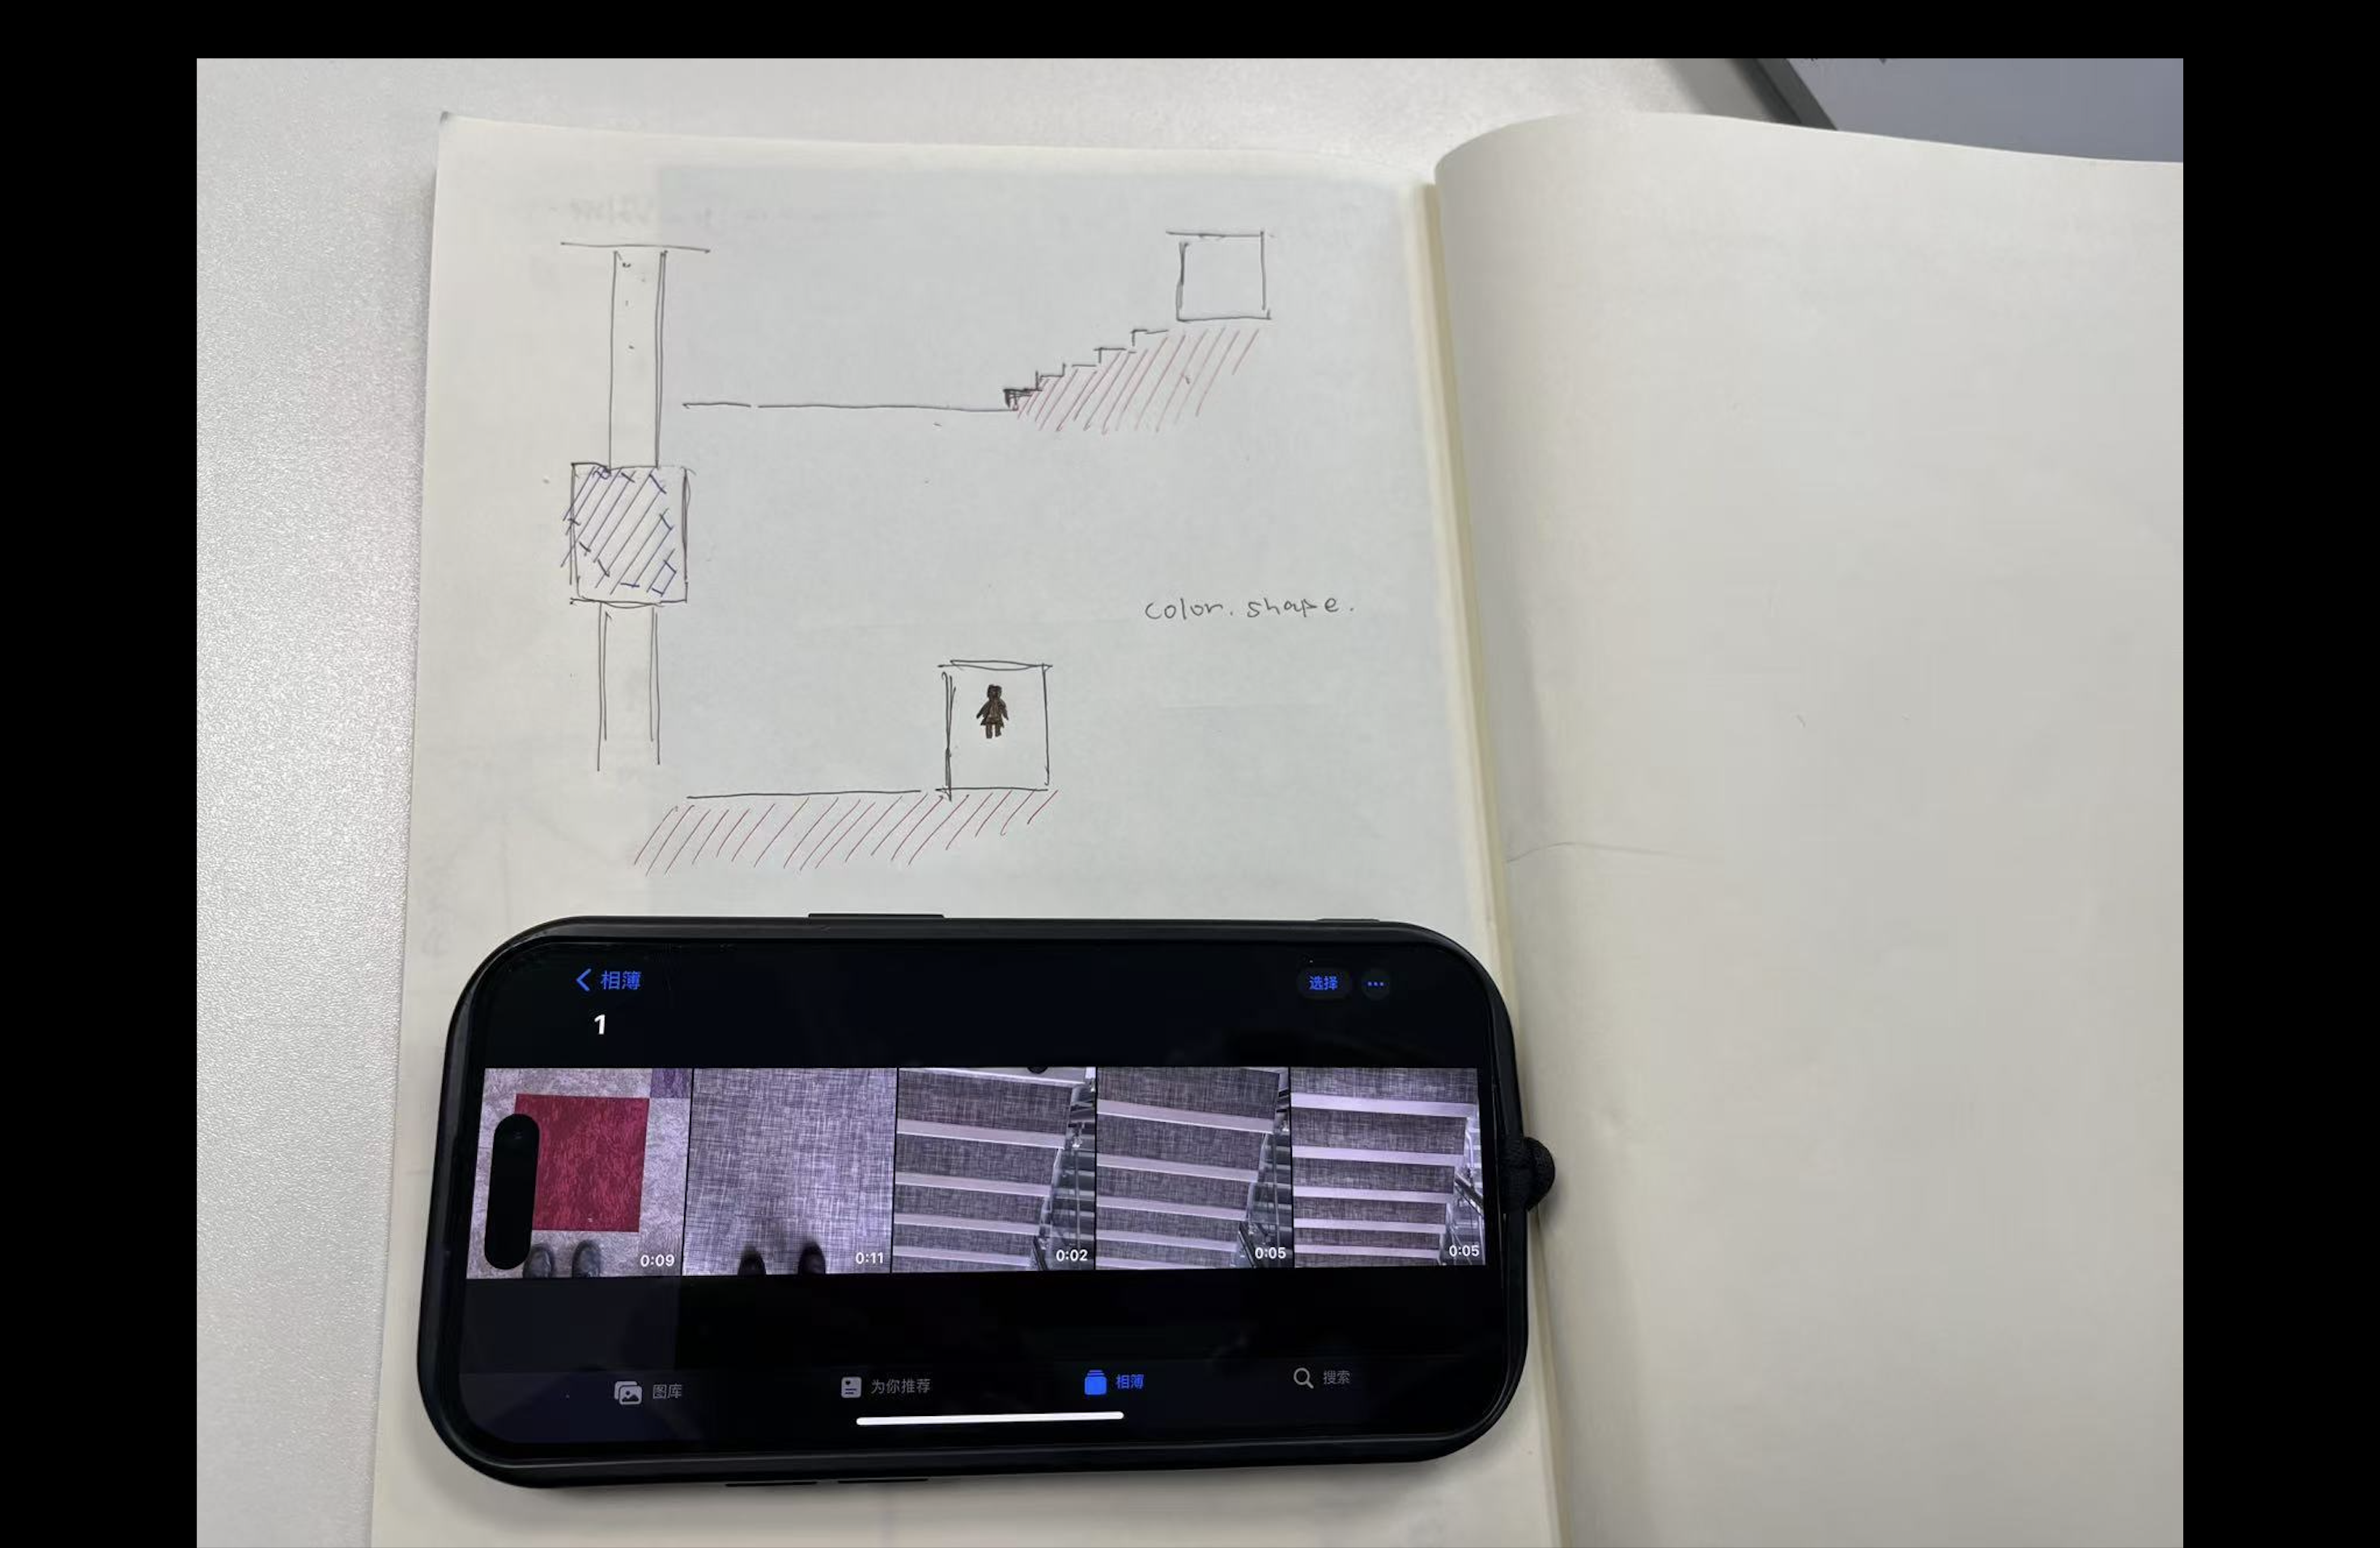
Then, by listening and recording different footstep sounds (in the classroom, in the lift, on the stairs, etc.), our group created a sensory map illustrating different auditory sensations in the building. We used red wavy lines to represent unsettling or loud noises and blue squares to symbolize softer, comforting sounds, effectively visualising the reactions triggered by these sounds. Representing sensory data visually proved challenging, especially in conveying subtle feelings accurately.
Sensory mapping presents how human experiences vary greatly based on sensory perception, reinforcing the importance of considering diverse sensory experiences in data representation. The process encouraged us to think innovatively about how digital media might effectively convey such intangible experiences. Overall, this activity demonstrates the power of sensory data in connecting historical narratives to embodied human experiences